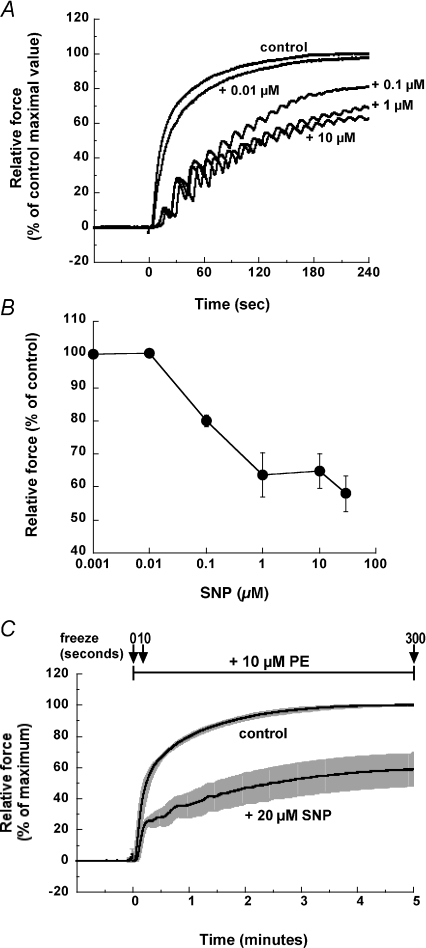
Figure 2. Time course and concentration–response relationship of SNP-induced inhibition of PE-induced contraction development in denuded rabbit femoral artery smooth muscle strips.
A, representative time courses of the development of 10 μm PE-induced contraction in the presence of various SNP amounts added 5 min before PE stimulation. Force was normalized with control PE-induced contraction in the absence of SNP. B, concentration–response relationship of SNP-induced inhibition of the steady-state level of PE-induced contraction (n= 4). C, time courses of 10 μm PE-induced contraction with s.e.m. in the presence and absence of 20 μm SNP (n= 5). SNP was added at rest 5 min before PE stimulation and was present throughout the experiments. The arrows indicate the freezing points at 0, 10 and 300 s after PE addition.

