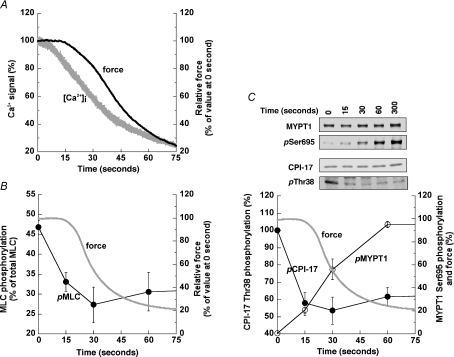
Figure 4. Time course of changes in Ca2+ (A), contractile force (A–C), and phosphorylation of MLC (B), CPI-17 at Thr38 (C) and MYPT1 at Ser695 (C) in response to 10 μm SNP added 3 min after PE exposure.
See Fig. 1 for the protocol. A illustrates representative simultaneous measurements of Fura-2 (F340/F380) ratio signal (grey) and contractile relaxation (black). Force levels were monitored throughout the experiments (average time course of force decline in B and C is identical to that in Fig. 1B). Phosphorylation of MLC (n= 4–9, B), and CPI-17 and MYPT1 (n= 4–6, C) with average time course of relaxation (grey) determined using two-dimensional electrophoresis and Western blot analysis (inset in C), respectively. Phosphorylation values of CPI-17 at Thr38 (pCPI-17; filled circles) and MYPT1 at Ser695 (pMYPT1; open circles) were normalized with the value at 0 s and 5 min of SNP exposure, respectively.

