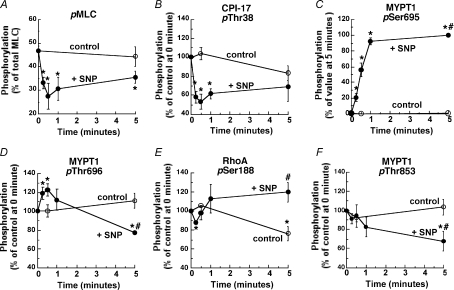
Figure 5. Time course for changes in phosphorylation of MLC (A, pMLC), CPI-17 (B, pThr38), MYPT1 Ser695 (C, pSer695), MYPT1 Thr696 (D, pThr696), RhoA Ser188 (E, pSer188) and MYPT1 Thr853 (F, pThr853) in response to 10 μm SNP (filled circles) as compared to those of control during PE-induced contraction (open circles).
Phosphorylation values of CPI-17, RhoA and MYPT1 Thr696 and Thr853 were normalized with a respective value at 0 min while MYPT1 Ser695 phosphorylation with a value at 5 min in the presence of SNP (n= 3–6). Asterisks (*) show the significant difference when data points are compared to the control value at the time zero before SNP and # when data points at 5 min after SNP are compared to the control value at 5 min.

