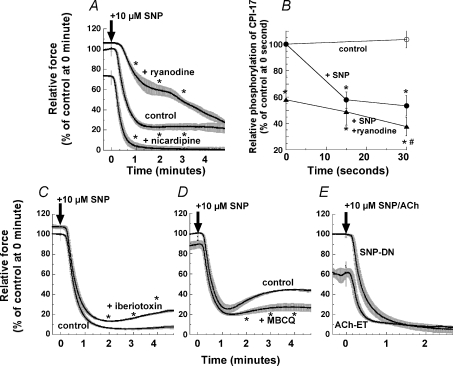
Figure 6. Effects of various inhibitors on 10 μm SNP-induced relaxation (A, C and D) during PE-induced contraction, and the effect of ACh on endothelium-intact compared to SNP in denuded arteries (E).
A, ryanodine represents the SNP-induced relaxation of ryanodine-pretreated strips with s.e.m. (see Methods) in the presence of 1 μm ryanodine (n= 6). Nicardipine represents the pretreatment with 1 μm nicardipine for 5 min before PE stimulation. B, time course of CPI-17 dephosphorylation induced by SNP in the ryanodine-treated artery compared to those of control with and without SNP in untreated artery strips, which are identical to those in Fig. 5B. Strips were treated with 0.3 μm iberiotoxin (n= 5) (C) and 1 μm MBCQ (n= 4) (D) for 10 min before and during PE-induced contraction. E, paired comparison between the time courses of SNP-induced relaxation in denuded (DN) and ACh-induced relaxation in endothelium-intact (ET) artery strips (n= 3 for each) from the same femoral artery. The force level developed in the endothelium-intact artery was normalized with one in the same strips thereafter treated with 100 μm l-NAME. Asterisks in the panels except B illustrate the significant difference at 1, 2, 3 and 4 min after SNP when the data are compared to control at the same time points. In B, asterisks show the significant difference when the data in the presence of SNP are compared to control at time zero in the absence of SNP, and # when the data in the ryanodine-treated artery strips after SNP are compared to the ryanodine-treated control at time zero before SNP.

