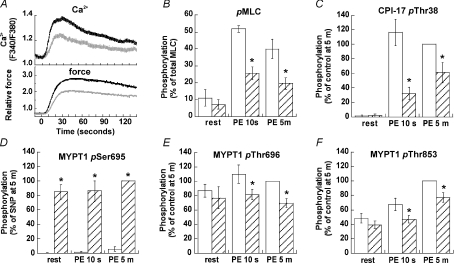
Figure 7. Effect of pretreatment with SNP on the time course of PE-induced Ca2+ rise (A, upper), force development (A, lower), and phosphorylation of MLC (B, n= 3), CPI-17 (C, n= 6) and MYPT1 at Ser695 (D, n= 6), Thr696 (E, n= 5) and Thr853 (F, n= 6).
Panel A shows a representative time course of Ca2+ and force in the presence (grey) and absence (black) of 20 μm SNP. Panels B–F illustrate the effect of SNP on phosphorylation of MLC, CPI-17 and MYPT1 (hatched columns) at rest and after 10 s and 5 min of PE stimulation compared to respective control values in the absence of SNP (open columns). The experimental protocol is illustrated in Fig. 2C. Asterisks indicate significant difference from control at the same time point.

