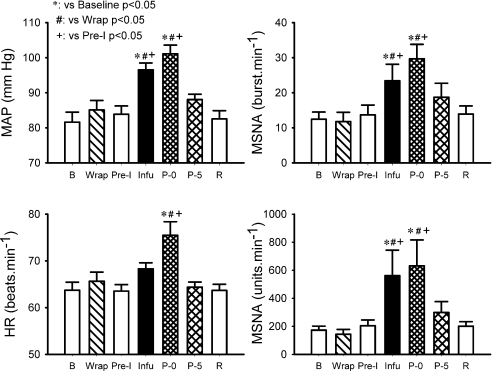
Figure 4. Mean arterial blood pressure (MAP), heart rate (HR) and MSNA measured as burst rate (right upper panel) and total activity (right lower panel) during the Bier block procedure in the second visit.
Pre-I: pre-infusion, a 3 min period just before the onset of the saline infusion. Subject number = 7.

