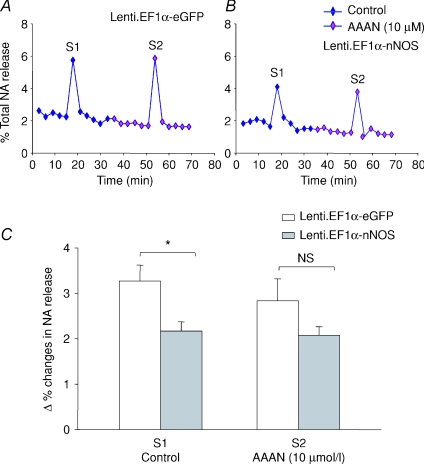
Figure 8. nNOS decreases NA release.
A and B, typical data trace showing measurement of [3H]NA release from isolated atria in response to 5 Hz field stimulation in Lenti.EF1α-nNOS- (A) and Lenti.EF1α-eGFP- (B) transduced group at 4 months. S1 and S2 represent the first and second stimulation. C, the data show NA release in Lenti.EF1α-nNOS-treated tissue (n= 7) was significantly decreased at S1 compared to Lenti.EF1α-eGFP group (n= 5, *P < 0.05, unpaired t test). There is no significant difference at S2. Percentage changes in NA release were expressed as a ratio of average increases in NA radioactivity 3 min following the electrical stimulation over the total radioactivity measured at all time points.

