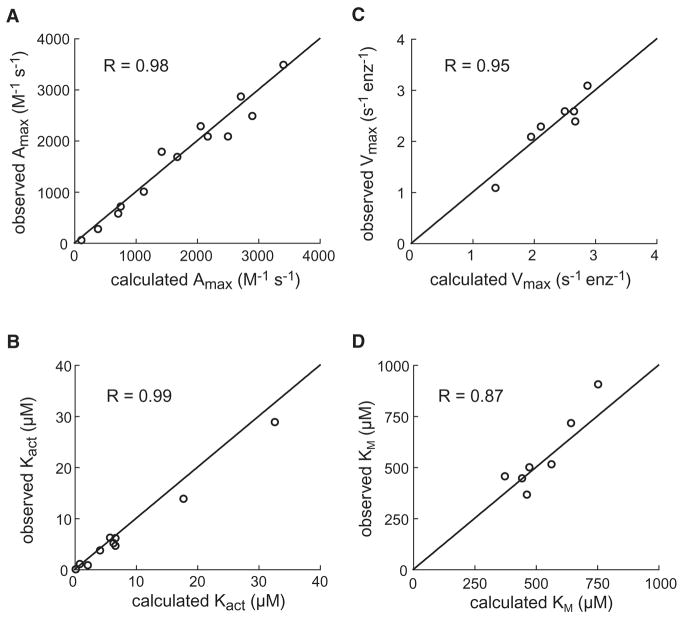
Figure 6.
Correlations between predicted and experimental parameters.
(A) Second-order rate constants for cleavage by DegS or mutants with saturating OMP-peptide and RseA substrate (200 μM). (B) OMP-peptide concentrations required for half-maximal activation of RseA (200 μM) cleavage by DegS or mutants. (C) Maximal rates of cleavage by DegS or mutants with saturated RseA substrate and OMP peptide. (D) Substrate concentration required for half-maximal cleavage by DegS or mutants with saturating OMP peptide. In each panel, predicted values were calculated from the MWC allosteric model using the parameters listed in Table 1D, and the correlation coefficients are for fits to the equation: y = x.

