
Figure 3.
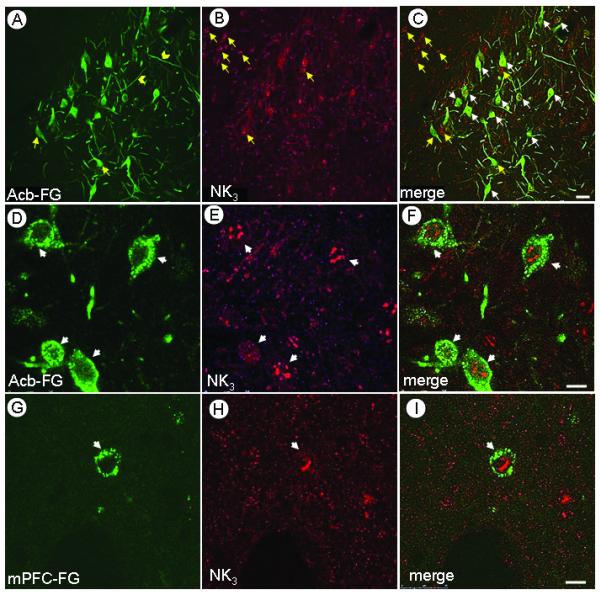
Confocal images showing co-localization of FG and the NK3 receptor in the VTA of rats receiving FG in either the Acb or mPFC. A-C. Low magnification micrograph showing single FG (A) or NK3 (B) immunolabeling (yellow arrows), and overlay of both markers (C, white arrows). DI Immunofluorescence labeling of FG (Green; D,G) and NK3 (Magenta; E,H) is seen either in soma (arrows) or dendrites (chevrons). When merged (F,I), the nuclear labeling of NK3 is apparent in either the VTA neurons providing inputs to the Acb (F) or mPFC (I). NK3 receptor immunofluorescence aggregated in the region of the nucleus. Scale bars: A-C, 30 μm; D-I,10 μm.