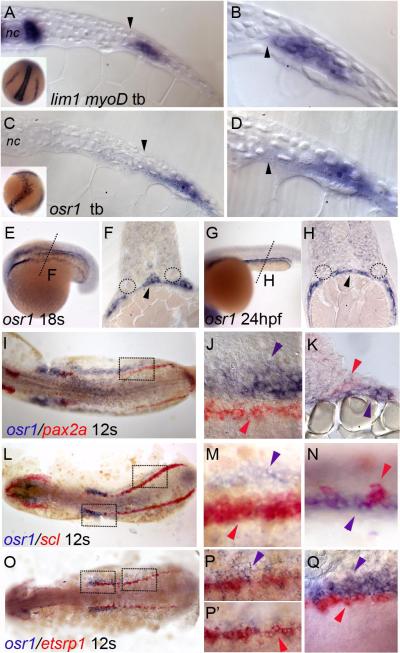
Figure 2. osr1 expression during zebrafish development.
(A) Cross section of a tailbud stage embryo showing expression of lim1 in cells of the IM (A, inset) adjacent to presomitic mesoderm (arrowhead) and myoD in adaxial cells adjacent to the notochord (nc,). (B) Magnification of A showing proximity of lim1 positive IM to the border of presomitic mesoderm (arrowhead). (C) Cross section of a tailbud stage embryo showing expression of osr1 in bilateral stripes (inset, C) in cells lateral and ventral to the expression of lim1 (C, D) (arrowheads mark the anatomical border of presomitic mesoderm. (E) At 18 somites osr1 is expressed in bilateral stripes just anterior to the somites and in lateral mesoderm of the trunk and tail. (F) Cross section of embryo in (E) at the level indicated by a dotted line in E showing osr1 expression ventral and lateral to the pronephros (dotted circles in F) and endodermal cells (arrowhead, F). (G) osr1 expression at 24 hpf in cells overlying the yolk extension. (H) Cross section of the embryo in (G) at the level indicated shows osr1 expression in the ventrolateral mesoderm distinct from the pronephric ducts (dotted circles) and in endoderm (arrowhead, H). (I-K) Expression of osr1 (blue) and pax2a (red). (J) Magnified views of boxed region in (I) show non-overlapping expression of osr1 (blue arrowhead) and pax2a (red arrowhead) in the intermediate mesoderm. (K) Cross section at the same level shows expression of osr1 (blue arrowhead) in cells ventral and lateral to the cells expressing pax2a (red arrowhead). (L-N) Expression of osr1 (blue) and scl (red) at 12 somites. Magnified views of boxed regions in (L) show non-overlapping expression of osr1 and scl in the posterior (M) and anterior (N) regions of the PLM. (O-Q) Expression of osr1 (blue) and etsrp1 (red) at 12 somites. Magnified views of boxed regions in (O) show non-overlapping expression of osr1 and etsrp1 in the posterior (P, P’) and anterior (Q) regions of the PLM. (P, P’) Magnified view of the boxed region in (O) at different focal planes showing osr1 and etsrp1 positive cells at different dorso-ventral positions with osr1 in more ventral (P) and etsrp1 in the more dorsal cells (P’) with reference to yolk cells.

