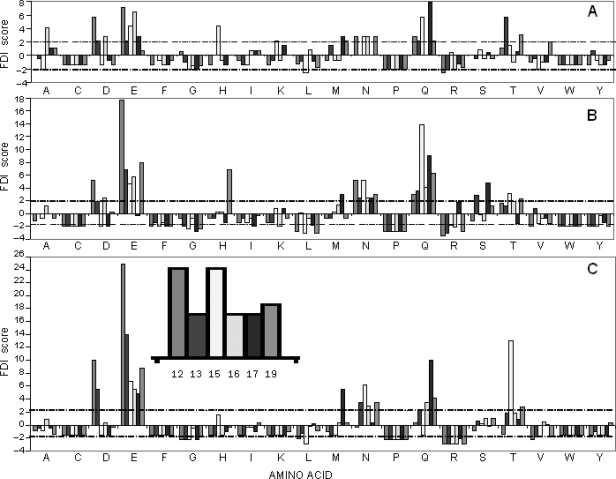
Fig. 7.
Frequencies of amino acids at different positions in the mutated area of 12–19 amino acids of pVIII proteins. The expected frequency of amino acids and the observed frequency calculated using AAFREQ program of the RELIC suite (Mandava et al., 2004) were used in adaptation of the one-sample test for proportion (Rosner, 2006). The results of the analysis were expressed as a frequency disparity index (FDI) which is a measure of how much the observed frequency deviates from the expected one. Amino acids at various positions of the mutated area (amino acids 12, 13, 15, 16, 17, 19) are depicted along the x-axis whereas the y-axis represents the FDI. FDIs for each amino acid are represented by clusters of columns, in which positions of each column correspond to the amino acid's position of the mutated area (see also Fig. 1). The dashed line represents statistical significance of the frequency disparity at the α-level of 0.05 (For more details see Kuzmicheva et al., 2009). (A) Parental f8α-library. (B) Amplified f8α-library. (C) G-α-library after the first round of affinity selection.

