
Figure 9.
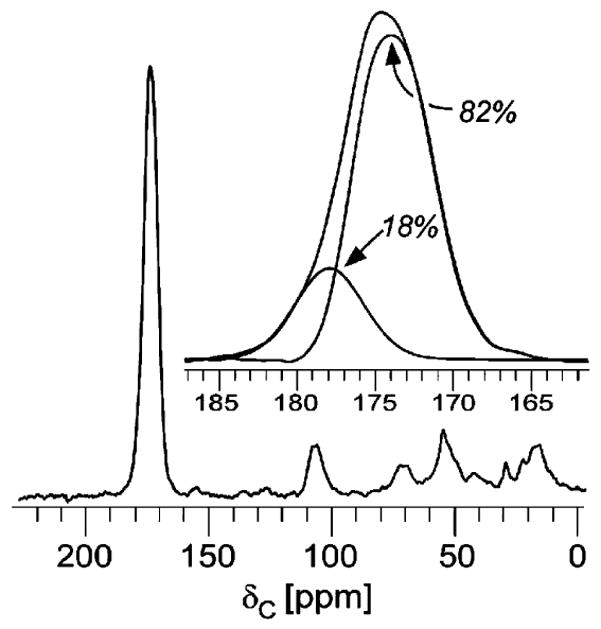
13C CPMAS echo spectrum of whole cells enriched with L-[1-13C]lysine. The carboxyl lysine peak at 178 ppm is unique to the cell wall, and its intensity can be determined by deconvolution using the line shape obtained from cell-wall isolates (inset). The lysine carboxyl termini represent 18% of the peak intensity, with stem-linked PG and cytoplasmic proteins accounting for the remaining 82%.