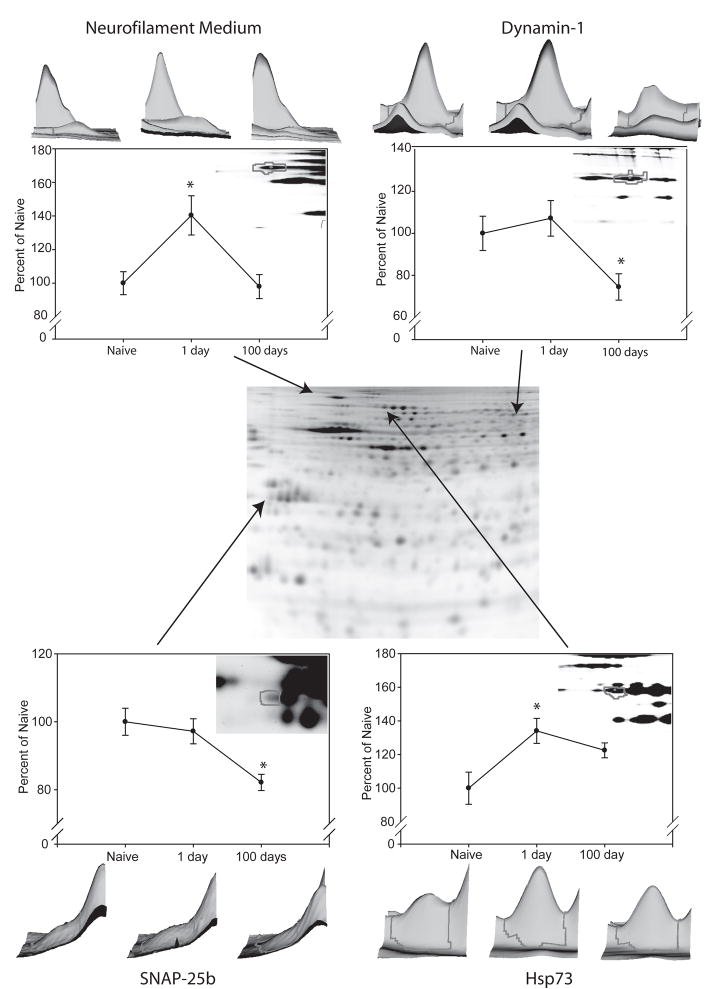
Figure 2. 2D-DIGE analysis with identified proteins of interest.
Samples from naïve, 1 day abstinent, and 100 day abstinent rats (n=6) were analyzed using 2D-DIGE. The center image is an example of a resulting gel, where separated proteins range in isoelectric point from pH 4–7 (left to right) and in molecular weight from ~140 to 20kDa (top to bottom). 4 proteins of particular interest are presented. 3-dimensional representations and graphs of each spot are created using DeCyder 6.5 software based on signal intensity and spot volume and are shown for neurofilament medium (upper left), SNAP-25b (lower left), dynamin-1 (upper right) and Hsp73 (lower right). *p<0.05, ANOVA followed by t-test.

