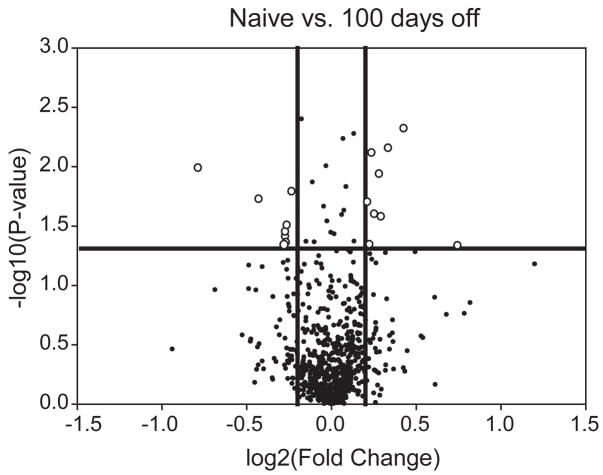
Figure 3. Volcano plot analysis of persistent proteomic changes.
Significant changes were observed between naïve and 100 day abstinent rats (t-test p<0.05; above the horizontal line). Adding a fold-change cut-off of ± 1.20 (outside of the vertical lines) reveals 20 changes of greater than ±1.2 fold at a p-value of <0.05 (open circles).

