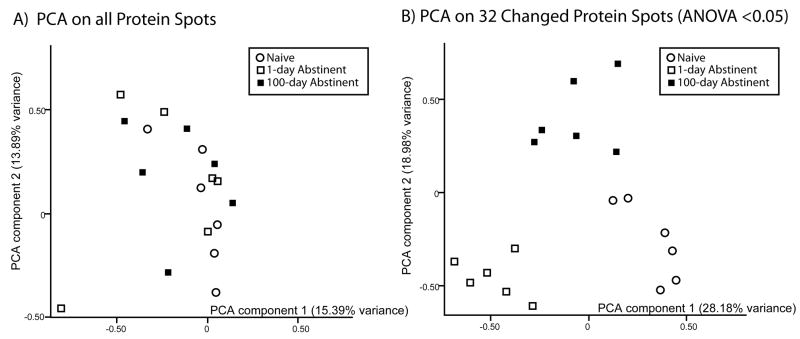
Figure 5. Principal component analysis of changed proteins.
PCA analysis allows visualization of the protein expression patterns of individual rats. A) PCA analysis using data from all of the protein spots. Based on the expression profiles of all protein spots, individual rats do not segregate into groups. B) PCA analysis using data from changed proteins. Analysis of the expression profiles of changed proteins only (p<0.05) correctly separates individuals based on grouping: naïve (open circles), 1 day (open squares) and 100 days abstinent (closed squares).

