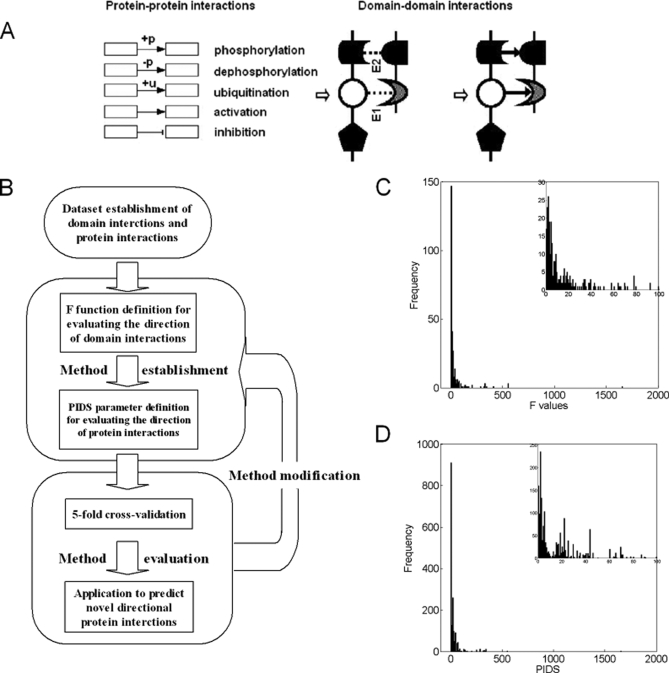
Fig. 1.
Diagram of the method and its workflow. A, a diagram of the direction between interacting domains. E1 and E2 represent two pairs of interacting domains. B, the work flow of the method. C, distribution of absolute F values in domain interactions. D, distribution of absolute PIDS values in protein interactions.

