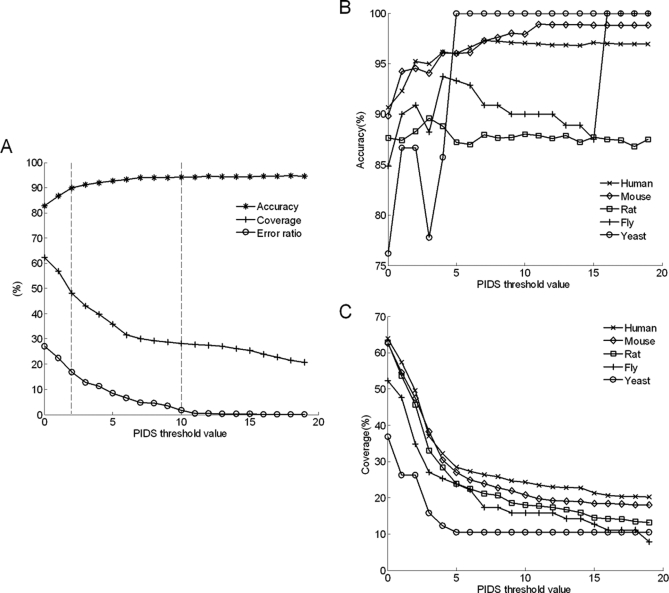
Fig. 2.
Performance evaluation of the method. A, accuracy, coverage, and error ratio versus different thresholds of PIDS using 5-fold cross-validation. The upright lines mark the recommendatory thresholds of PIDS with 2 and 10. B, predicting accuracy versus threshold values across different species. C, predicting coverage versus threshold values across different species.

