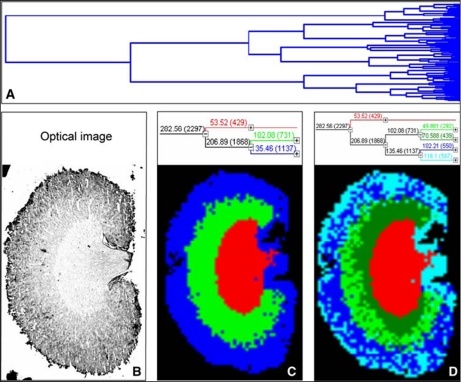
Fig. 4.
Hierarchical clustering of a mouse kidney data set achieved by MALDI-MSI. A, full dendrogram of all spectra in a mouse kidney data set. B, optical image of the mouse kidney analyzed by MALDI-MSI. C and D, reconstruction of selected dendrogram branches and corresponding images. The three main branches reflect the renal cortex (blue), medulla (green), and pelvis (red). C, the medulla branch separates into two distinct areas, whereas the cortex branch further differentiates into fat and connective tissue of the renal capsule and hilus and the actual cortex (D). (Reprinted with permission of Walch et al. (44).)

