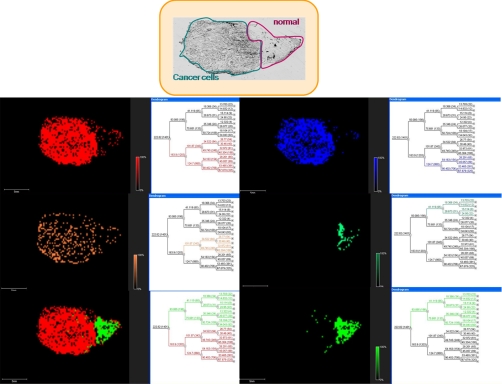
Fig. 5.
Hierarchical clustering using the ClinProt tool (Bruker Daltonics) after PCA of a stage 4 mucous ovarian carcinoma section covered with ionic matrix using the Shimadzu CHIP 1000 microspotter. a, optical image of the ovarian carcinoma section. b–f, reconstructed selected dendrograms and corresponding images. The two main branches reflect the carcinoma (red; a) and the healthy (green; f) parts in the section. b and c are two carcinoma subclasses, and d is a subclass of the healthy part. e represents a merge of the two branches.

