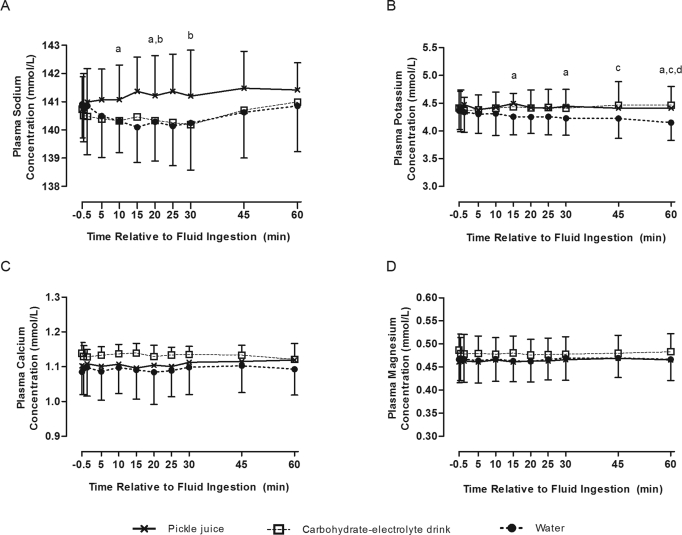
Figure 2.
Mean plasma electrolyte concentrations 60 minutes postingestion of pickle juice, carbohydrate-electrolyte drink, and water. A, Plasma sodium concentration. To convert mmol/L to mEq/L, divide the given value by 1. B, Plasma potassium concentration. To convert mmol/L to mEq/L, divide the given value by 1. C, Plasma calcium concentration. To convert mmol/L to mEq/L, divide the given value by 0.25. D, Plasma magnesium concentration. To convert mmol/L to mEq/L, divide the given value by 0.50. a Pickle juice different from water. b Pickle juice different from carbohydrate-electrolyte drink. c Carbohydrate-electrolyte drink different from water. d Water different from baseline measurement. The α level was set at <.05. Error bars denote SDs.

