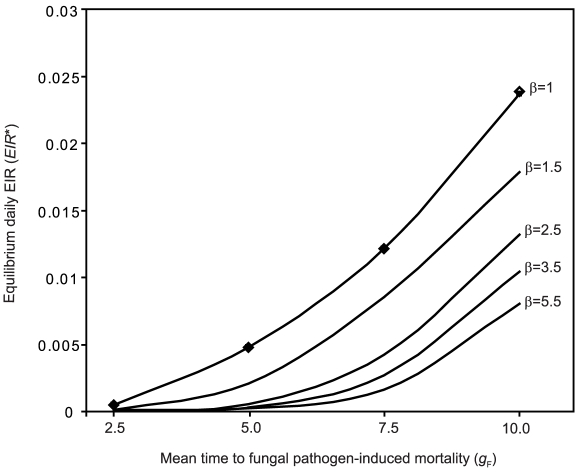
Figure 2. Comparing equilibria obtained by simulation and analytic derivation.
Equilibrium daily EIR as a function of the mean time to death if the fungus is the only mortality source ( ) for different values of the shape parameter
  and other parameters as in Table 1. For
  values of the equilibrium daily EIR obtained by analytic derivation (open diamonds) and simulation (black squares) are compared. Sublethal effects of fungal infection on mosquito feeding biology are not incorporated (
 &
&  ).
).

