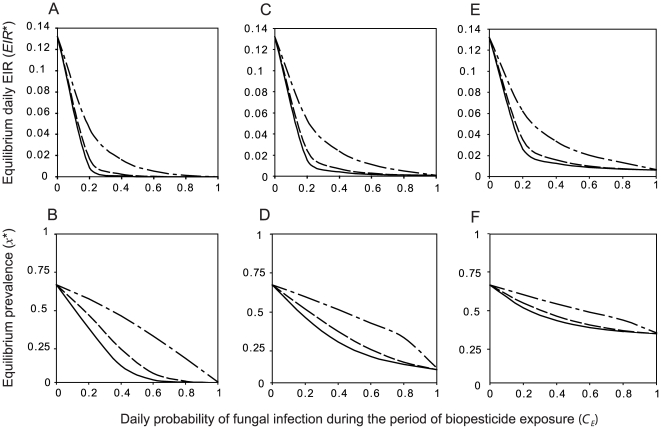
Figure 5. The effect of varying the period of biopesticide exposure in a given gonotrophic cycle.
Equilibrium daily EIR and equilibrium human prevalence as a function of the daily probability of fungal infection during the period of biopesticide exposure (CE) for three values of the mean time to death from fungal infection ( ): A–B.
  , C–D.
  , E–F.
  . Lines represent biopesticide exposure periods (see text) corresponding to
  (solid lines),
  (dashed lines) and
  (dot-dashed lines).

