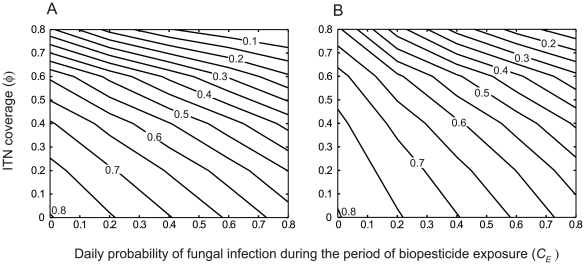
Figure 8. The effect of the combined interventions on human prevalence for high transmission.
Isolines of the equilibrium human prevalence ( ) for varying ITN coverage (
 ) and daily probability of fungal infection during the period of biopesticide exposure (CE), for different ITN intervention parameters: A. The ITN intervention parameters given in Table 1, B. The ITN intervention does not affect mosquito mortality (other ITN intervention parameters are as in Table 1). The transmission intensity is high (annual EIR = 412). The mean time to death from fungal infection is
  .
.

