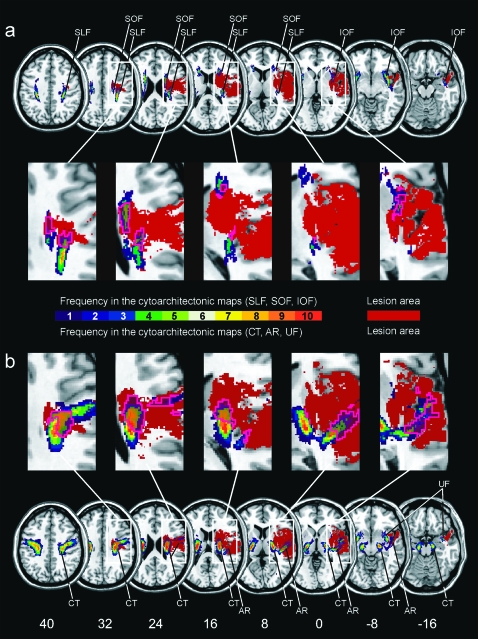
Figure 2.
Overlap of the statistical lesion map from Figure 1 (in homogenous brown color) with the probabilistic, cytoarchitectonic maps of the white matter fiber tracts from the Jülich atlas (right hemisphere only). The color coding of the atlas from 1 (dark blue, observed in 1 postmortem brain) to 10 (red, overlap in all 10 postmortem brains) represents the absolute frequency for which in each voxel of the atlas a respective fiber tract was present (e.g., a 30% value of a fiber tract in a certain voxel of the reference brain indicates that the fiber tract was present in that voxel in 3 out of 10 postmortem brains). The pink contour demarks the area of the fiber tracts affected by the statistical lesion map. (a) Overlap illustrated for fiber tracts SLF, superior longitudinal fasciculus; IOF, inferior occipitofrontal fasciculus; and SOF, superior occipitofrontal fasciculus. (b) Overlap illustrated for fiber tracts CT, corticospinal tract; AR, acoustic radiation; and UF, uncinate fascicle.

