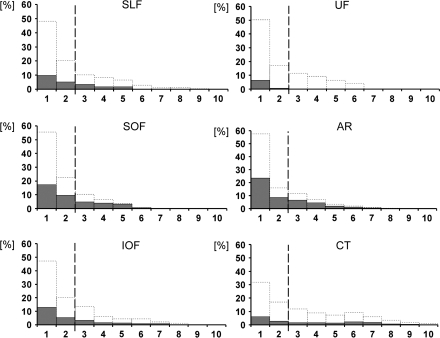
Figure 3.
Quantitative analysis of the data presented in Figure 2. In each of the 6 panels, the area under the dotted lines represents the entire area of a certain anatomical fiber tract from the Jülich atlas (100% of, e.g., the SLF). Along the x-axis, this area is subdivided and plotted according to the percentage with which in each voxel of the atlas the respective fiber tract was present (from 1 to 10). The numbers along the x-axis thus correspond with the color coded illustration of the respective voxel category from Figure 2 (frequency 1–10). The gray bars on top of the dotted bars indicate the percentage of involvement of each of the voxel categories (frequency 1–10) from the respective fiber tract by the statistical map (e.g., a 20% value of a gray bar in category “5” indicates that 20% of all category 5 voxels of that particular fiber tract had been covered by the statistical lesion map). The dashed line indicates the 30% isocontours of the maps from the Jülich atlas. SLF, superior longitudinal fasciculus; IOF, inferior occipitofrontal fasciculus; SOF, superior occipitofrontal fasciculus; CT, corticospinal tract; AR, acoustic radiation; and UF, uncinate fascicle.

