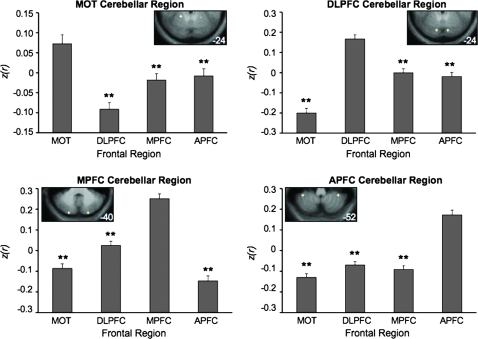
Figure 9.
Fronto-cerebellar circuits dissociate in an independent data set. Spherical seed regions of 2-mm radius were drawn around local maxima in the cerebellar maps generated from Data Set 1. These regions were then carried forward and tested in the independent Data Set 2 to formally quantify the dissociation between the 4 fronto-cerebellar circuits. Each graph depicts the mean z(r) between a given (bilateral) cerebellar region and each of the 4 bilateral frontal target regions. The cerebellar seed regions are depicted in the insets on each graph (coordinates: MOT cerebellar region: ±20, −50, −24; DLPFC cerebellar region: ±12, −80, −24; MPFC cerebellar region: ±22, −86, −40; APFC cerebellar region: ±36, −46, −52). **P < 0.001.

