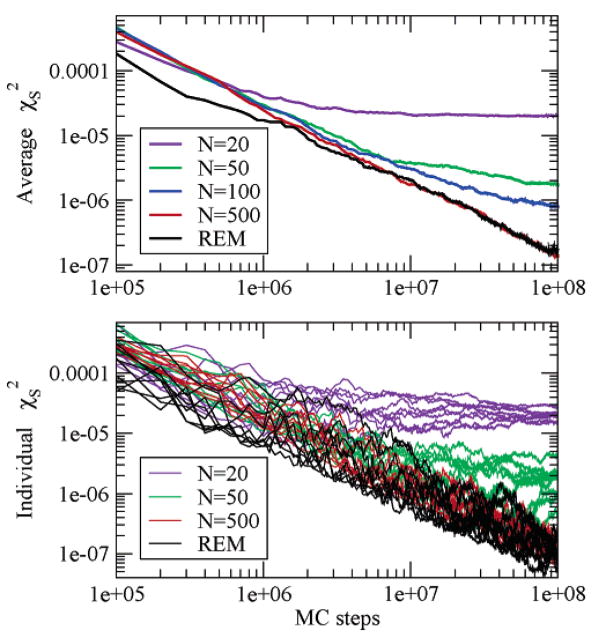
Figure 10.
Integrated squared error of the spatial density, χS2, shown for the REM and several versions of the SREM. The top panel demonstrates the behavior of the SREM versus the REM in terms of χS2, averaged over 50 individual trajectories. The lower panel shows nine individual trajectories for the REM and SREM, with N = 20, 50, and 500.

