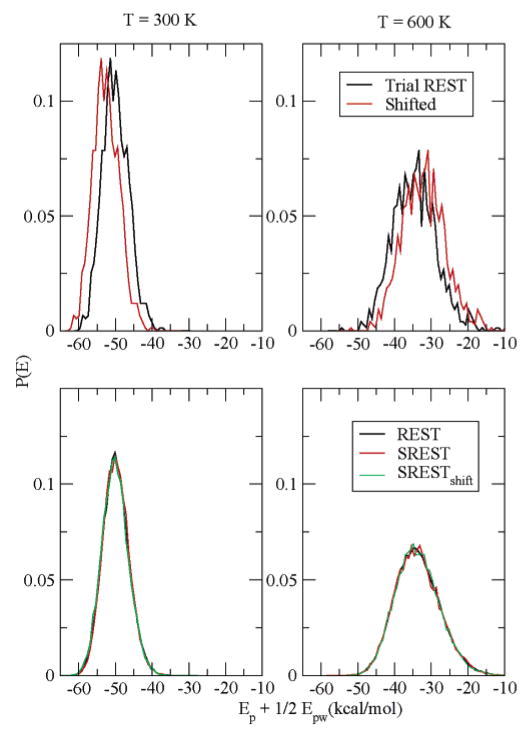
Figure 6.
Potential energy distributions for two temperatures, 300 K (left column) and 600 K (right column). The black and red curves in the top panels correspond to the original rough PEDFs from the trial REST simulations and the shifted counterpart. The black, red, and green curves in the bottom panels show the converged PEDFs from a 9 ns REST simulation, the 2 ns aging process in SREST, and the 2 ns aging process in the SRESTshift simulation, respectively. The SREST and SRESTshift results are averaged over three independent runs.

