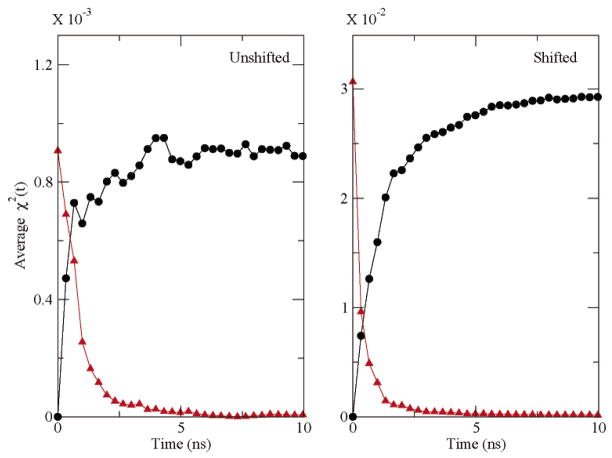
Figure 7.
Convergence measure of the potential energy distributions as a function of the CPU time at 300 K from SREST (left panel) and SRESTshift (right panel) simulations. The curves of χ2(t), using and as the reference states, are plotted in black and red, respectively. We stop updating the PEDFs after 2 ns in each simulation. The χ2(t) values are obtained from three concatenated independent runs and averaged over all temperature levels.

