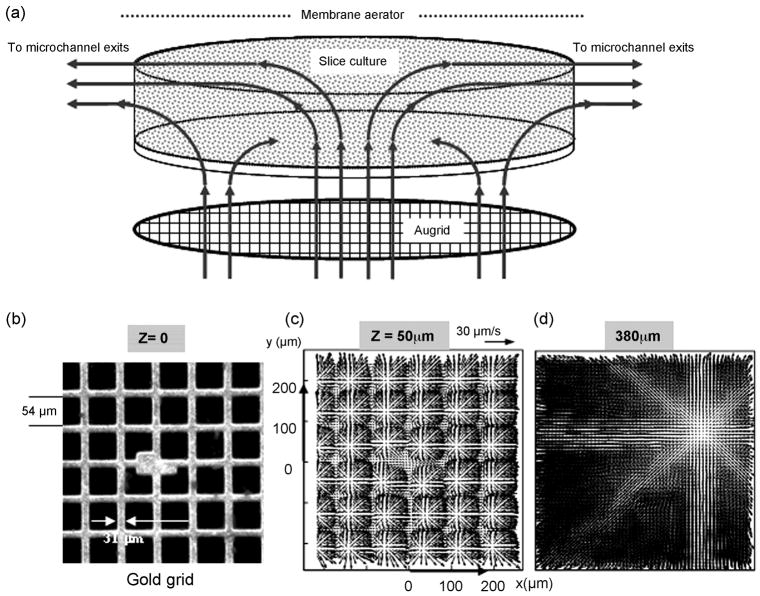
Figure 3.
Schematic of the induced flow within the culture chamber. (a) Measurement domain and (b) measured velocity distributions within the culture chamber. (c–d) Measurements were taken in several planes that are parallel to the porous grid perfusion substrate and normal to the axes of microjets emanating from about 584 square openings of a gold mesh. The elevation, Z, is measured from the perfusion substrate. (b) The field of view includes the central portion of the gold screen (450 × 457μm) with an array of about 6 × 6 nozzles in focus. The nominal volume flow rate is 5 μl/min, with microjet ejection velocity of about 50 μm/s and a nozzle based Reynolds number of 0.003. (c) Immediately downstream from the perfusion substrate, flow is characterized by the radial spreading of submerged, laminar microjets normal to their axes. Upon discharge from the micronozzles, microjets broaden, i.e. spread out radially. Momentum exchange between the jets and the lower momentum medium within the chamber causes this broadening with concomitant reduction in jet streamwise velocity (along their axes). A continuing reduction in jet streamwise momentum causes turning from their nominally vertical trajectories. Adjoining microjets begin to interact, lose coherence and merge. (d) Starting mid-height through the chamber, peripheral fluid withdrawal creates substantial 3D convection that drives the merging jet outflows towards the exit microchannels.

