Figure 5.
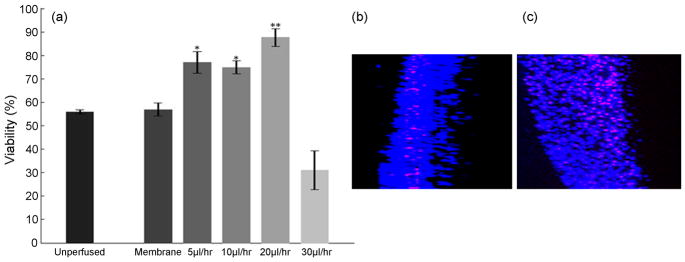
Evaluation of the useful range of perfusion rates. (a) Viability of cultures after 48 hrs of perfusion at chosen flow rates. The flow rate of 20μl/hr is optimal to maximize the viability. A generalized linear model ANOVA followed by a Tukey’s multiple comparison test was used to evaluate statistical significance. ** indicates p<0.01 compared to membrane and unperfused controls. * indicates p<0.05 compared to membrane and unperfused controls. (b,c) A partial view through the slice thickness (extracted from side view rendered with 3D projection) from unperfused and perfused cultures respectively at a flow rate of 30 μl/hr. Unperfused cultures are thinner, with the cell death prominently organized in layers with obviously higher cell density. The perfused tissue shows widespread cell death around the microchannels formed in the tissue due to excessive flow rate applied.

