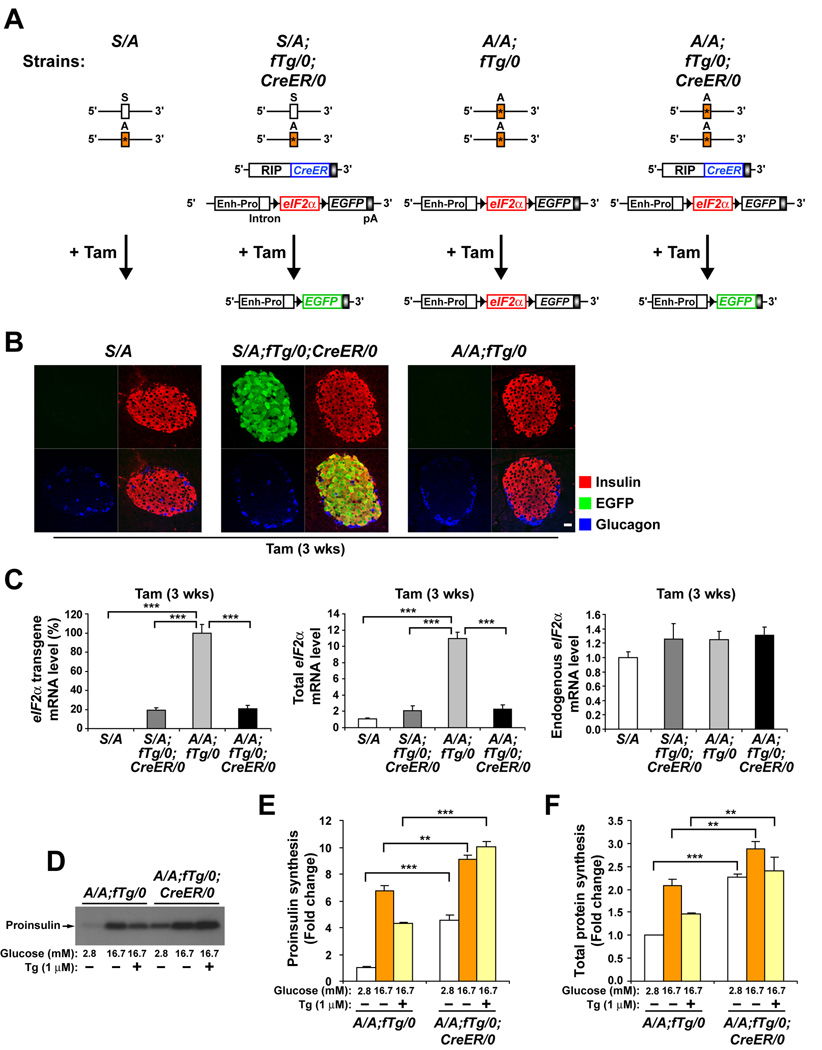
Figure 1. Ubiquitous expression of a floxed wt eIF2α transgene (fTg) in homozygous eIF2αA/A mice prevents lethality, preserves beta cell mass, and is required for glucose-regulated protein synthesis.
(A) Diagram depicts the four genotypes of mice used in these experiments. Heterozygous eIF2α S/A mice harbor Ser51Ala (*) mutation in exon 2 of one eIF2α allele. fTg/0 represents the floxed wt eIF2α transgene driven by the CMV- enhancer and chicken β-actin promoter (Enh-Pro). LoxP sequences (black arrowheads) allow excision of eIF2α coding sequence and coordinate expression of EGFP. CreER/0 represents the CreER recombinase transgene driven by the rat insulin II promoter (RIP). The deletion of fTg catalyzed by Tam treatment is represented.
(B) Tam-induced Cre recombinase deletion of wt eIF2α fTg is specific. Pancreatic tissue sections obtained from mice 3 wks after Tam administration were triple immunostained for EGFP, insulin, and glucagon and representative single channel fluorescence images are shown individually and merged (lower right image of each group). The scale bar represents 20 µm.
(C) Tam-induced Cre recombinase deletion of wt eIF2α fTg is efficient. The wt eIF2α fTg directs high-level conditional expression of wt eIF2α mRNA in beta cells. Tam was administered to all mice and after 3 wks total RNA was prepared from isolated islets. Results from quantitative RT-PCR analyses of transgenic, total, and endogenous eIF2α mRNAs are shown. n= 3 mice per group.
(D–F) eIF2α phosphorylation is required to attenuate protein synthesis in beta cells. Islets from tamoxifen-injected A/A;fTg/0 and A/A;fTg/0;CreER/0 mice were isolated and preincubated for 1 hr in Kreb’s buffer containing basal 2.8 mM glucose, followed by incuation for 1 hr in buffer containing 2.8 mM, 16.7 mM glucose, or 16.7 mM glucose and 1µM thapsigargin (Tg). Metabolic labeling with [35S] methionine and cysteine was performed during the last 20 min. of incubation as described in EXPERIMENTAL PROCEDURES. (D and E), Proinsulin synthesis was measured by immunoprecipitation from labeled extracts. (D) Immunoprecipitated samples were subjected to acrylamide gel electrophoresis and autoradiography. (E) Quantitation of labeled proinsulin by phosphorimaging is expressed as the fold change relative to A/A;fTg/0 islets incubated with 2.8 mM glucose. (F) Total protein synthesis was quantified by TCA precipitation of labeled extracts and results were normalized to total protein. n=3 samples per group. Data are Mean ± SEM, (C), (E), and (F).

