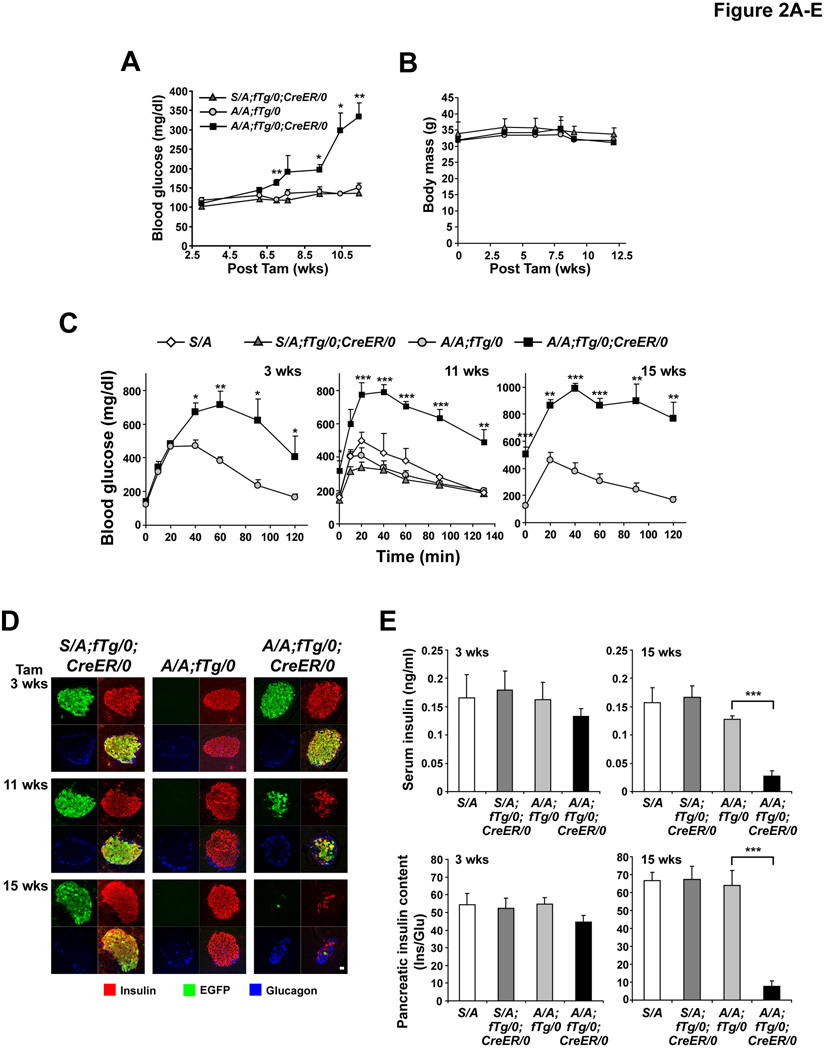
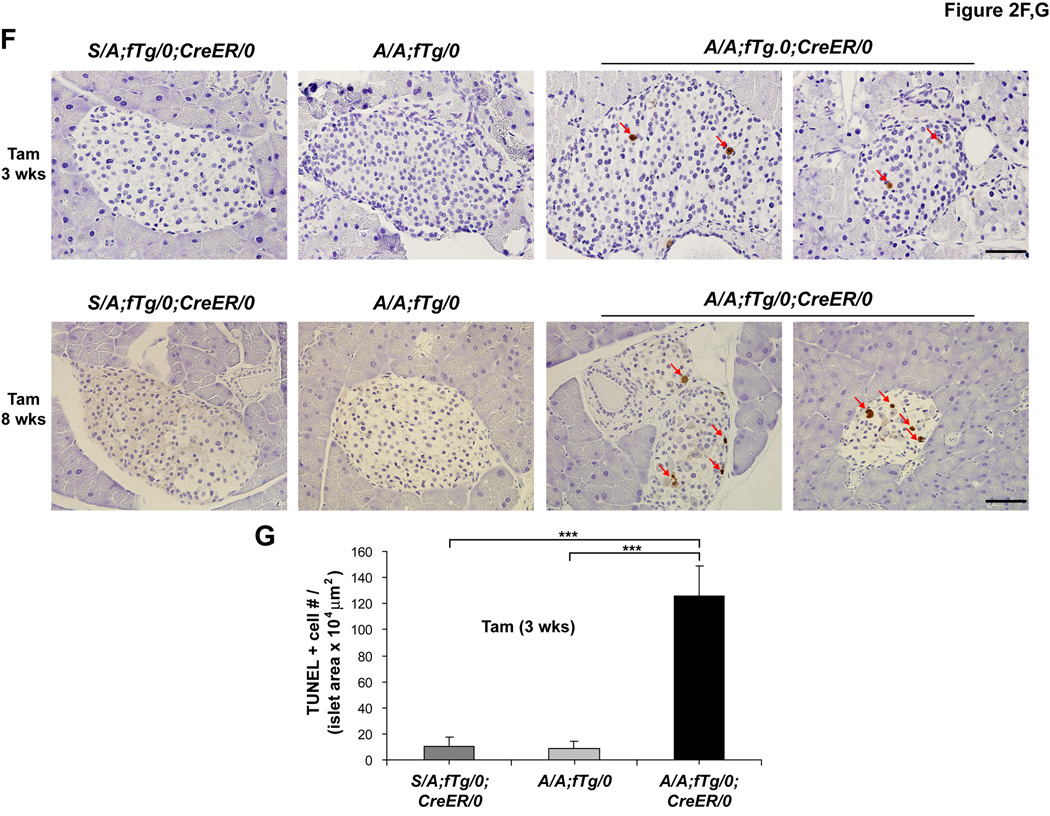
Figure 2. Beta cell-specific deletion of wt eIF2α fTg causes glucose intolerance due to reduced islet mass.
(A and B) At the indicated weeks after Tam injection, blood glucose (A) and body mass (B) measurements were performed in mice fasted for 5–6 hrs. n=5–6 mice per group. Significant differences between A/A;fTg/0 versus A/A;fTg/0;CreER/0 mice are indicated.
(C) GTTs were performed at 3–15 wks after Tam administration. n=5–6 mice per group. Significant differences between A/A;fTg/0 versus A/A;fTg/0;CreER/0 mice are indicated.
(D) Pancreatic tissue sections obtained from mice at the indicated times after Tam administration were triple immunostained for insulin, EGFP, and glucagon. Representative single channel fluorescence images are shown individually and merged (lower right image of each group). The scale bar represents 20 µm.
(E) Serum insulin levels and pancreatic insulin content were measured in mice at 3 and 15 wks after Tam injection. Insulin (Ins) measurements were normalized to glucagon (Glu). n=3–7 mice per group.
(F and G) TUNEL staining was performed on pancreatic sections obtained from mice at 3 and 8 wks after Tam injection and the number (#) of positive (+) cells per islet area was quantified. n = 5–7 mice per group. The scale bars represent 50 µm. Data are Mean ± SEM, (A–C), (E), and (G).


