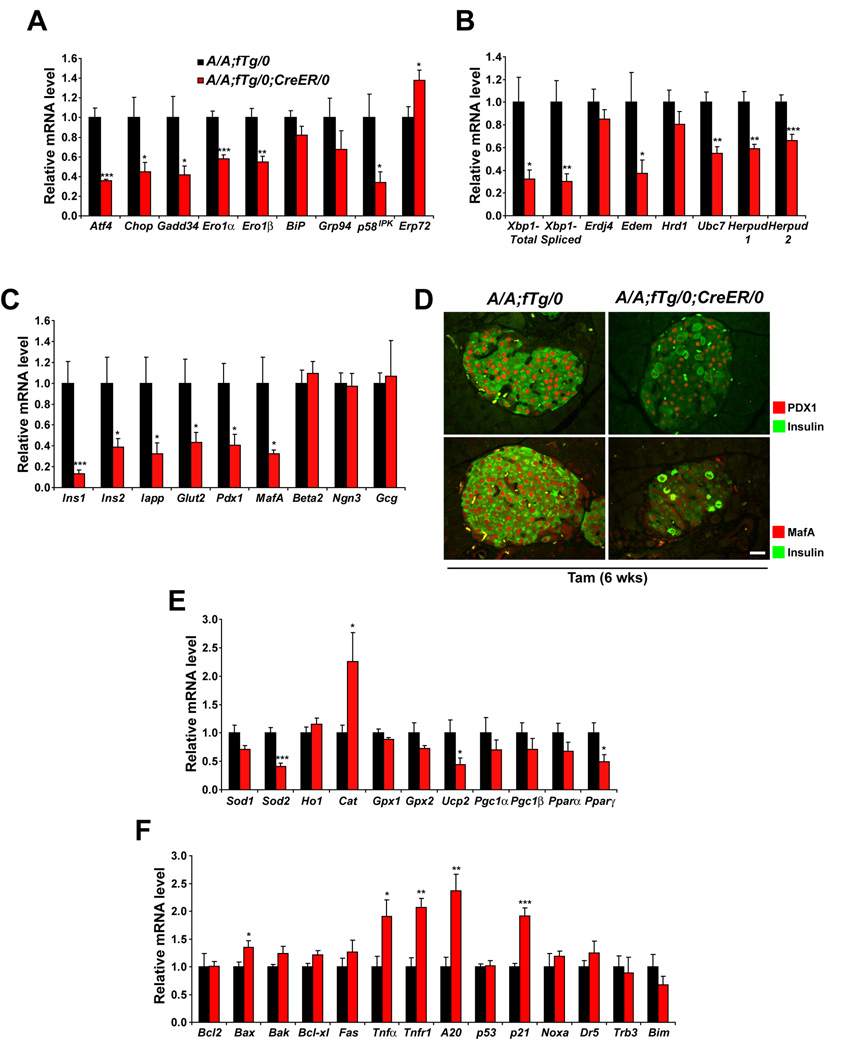
Figure 3. Translational control is required for optimal expression of UPR genes, antioxidant response genes, and beta cell-specific genes.
(A–C, E, and F) Total RNA was extracted from islets isolated from mice at 3 wks after Tam administration. Expression levels of mRNA were measured using quantitative RT-PCR. Data are Mean ± SEM, n= 5–6 mice per group.
(A) Genes regulated through eIF2α phosphorylation.
(B) Genes regulated through IRE1 α signaling and genes of ERAD machinery.
(C) Pancreatic beta or alpha cell-specific genes.
(D) PDX1, MafA, and insulin immunolabeling of pancreatic sections was conducted on samples isolated from mice at 6 wks after Tam administration. Representative merged images of PDX1 with insulin (upper panels) and MafA with insulin (lower panels) are shown. The scale bars represent 20 µm.
(E) Antioxidant response genes.
(F) Anti- and pro-apoptotic genes.

