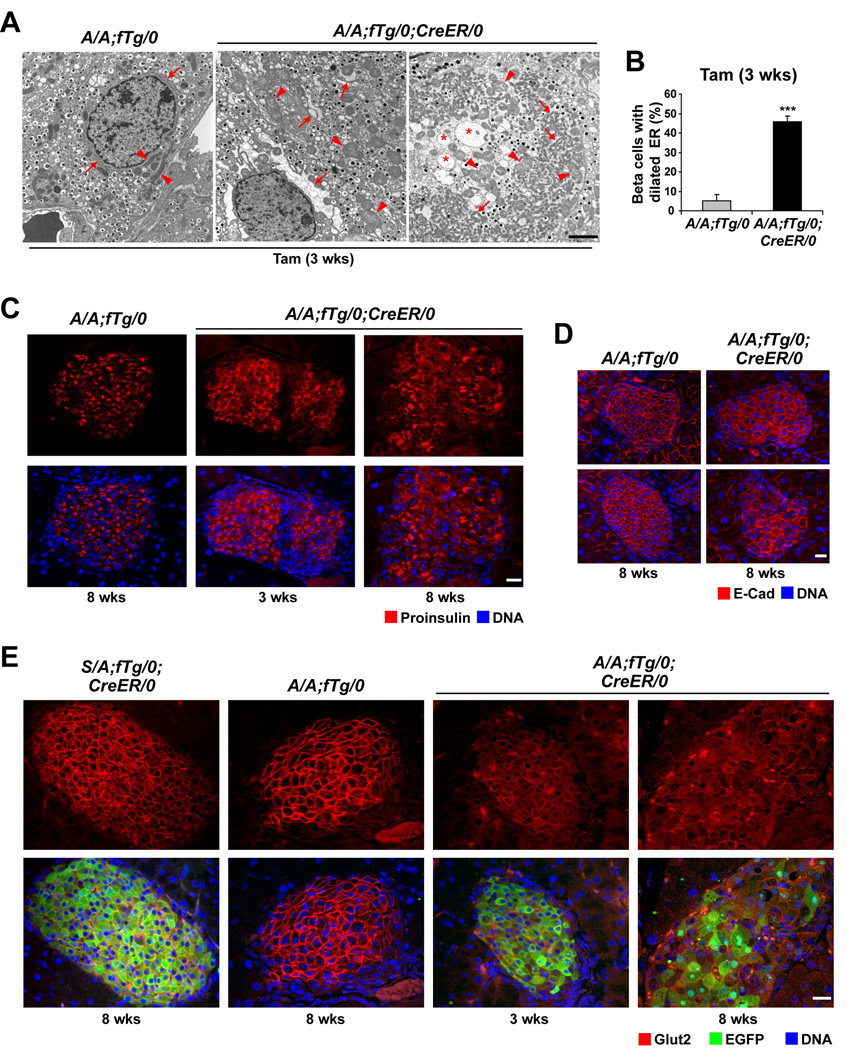
Figure 4. Translation attenuation is required for ER and mitochondrial integrity and proper protein trafficking.
(A and B) TEM was performed on pancreatic sections from A/A;fTg/0 and A/A;fTg/0;CreER/0 mice at 3 wks after Tam administration and representative images are shown. In the A/A;fTg/0 image, arrows indicate normal ER regions and arrowheads demark normal mitochondria. In A/A;fTg/0;CreER/0 images, arrows indicate regions of severe ER distention, asterisks indicate abnormal structures of low electron density, and arrowheads demark swollen mitochondria. The scale bars represent 2 µm. (B) The percentage of beta cells with dilated ER at 3 wks was quantified. Data are Mean ± SEM, n = 5–7 mice per group.
(C–E) Pancreata from mice at 3 and 8 wks after Tam administration were analyzed by immunofluorescence for proinsulin (C), E-Cad (D), and GLUT2 and EGFP (E). The scale bars represent 20 µm.

