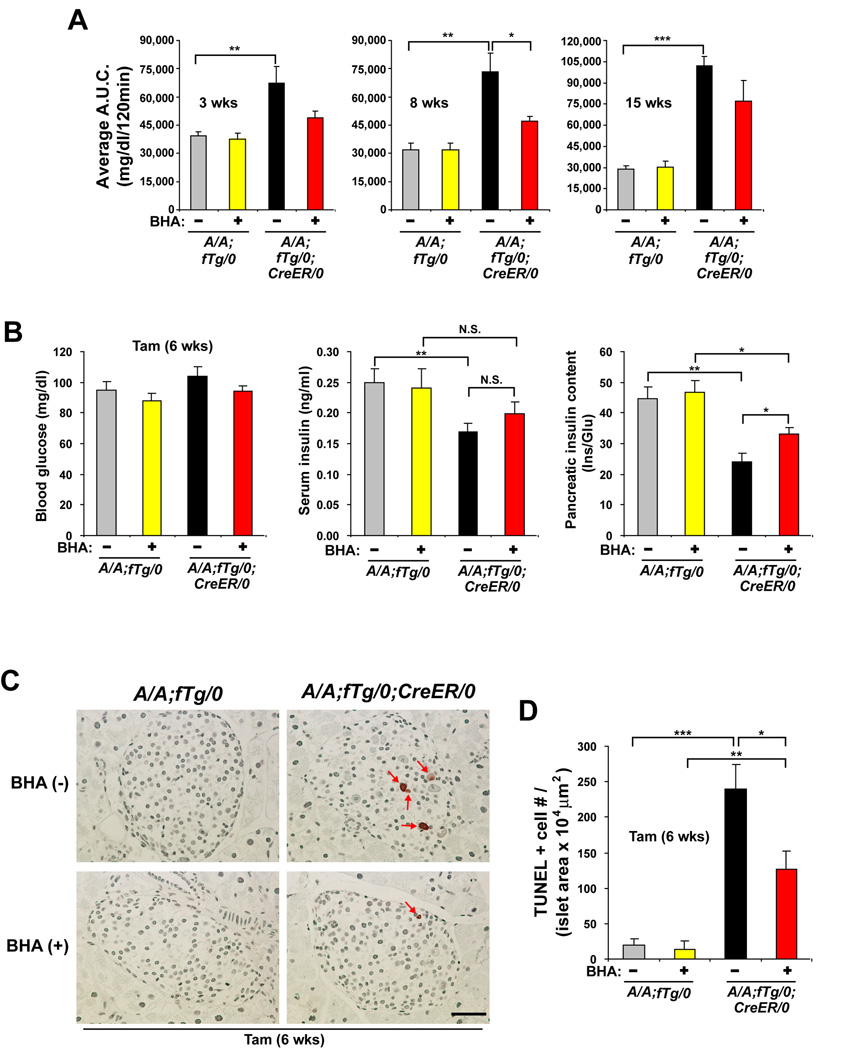
Figure 6. Antioxidant treatment preserves insulin production, reduces beta cell death and improves glucose intolerance in A/A;fTg/0;CreER/0 mice.
(A) GTTs were performed on mice fed chow supplemented with or without BHA for 3–15 wks after Tam treatment. The area under the curve (A.U.C.) from the GTTs was quantified. n=5–6 mice per group.
(B) Blood glucose (left panel), serum insulin (middle panel), and pancreatic insulin (right panel) were measured in A/A;fTg/0 and A/A;fTg/0;CreER/0 mice at 6 weeks after Tam injection with and without BHA feeding. Insulin measurements were normalized to glucagon (Glu). n=7–9 mice per group.
(C and D) TUNEL staining was performed on pancreatic sections obtained from mice at 6 wks after Tam injection and the number (#) of positive (+) cells per islet area was quantified. n = 7–9 mice per group. The scale bars represent 50 µm. Data are Mean ± SEM, (A), (B), and (D).

