
Figure 5.
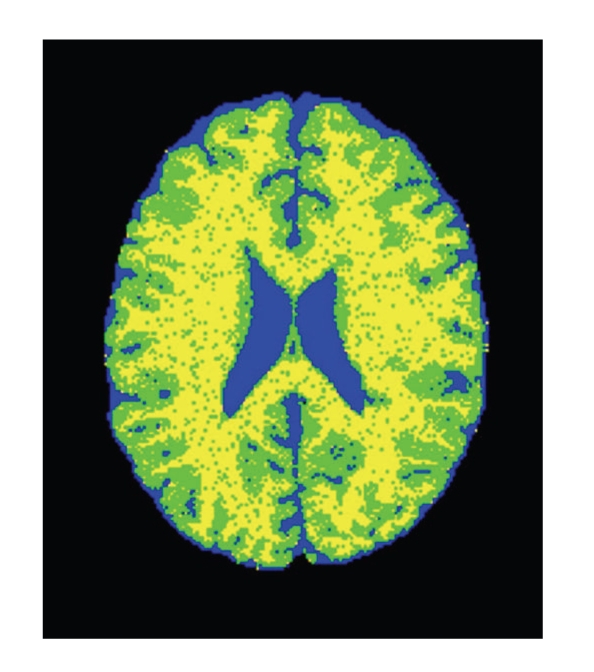
Intensity K-means segmentation. K = 3. BrainWeb data, slice 95 with 9% noise. Blue: CSF; Green: GM; Yellow: WM.
Official websites use .gov
A
.gov website belongs to an official
government organization in the United States.
Secure .gov websites use HTTPS
A lock (
) or https:// means you've safely
connected to the .gov website. Share sensitive
information only on official, secure websites.
Intensity K-means segmentation. K = 3. BrainWeb data, slice 95 with 9% noise. Blue: CSF; Green: GM; Yellow: WM.