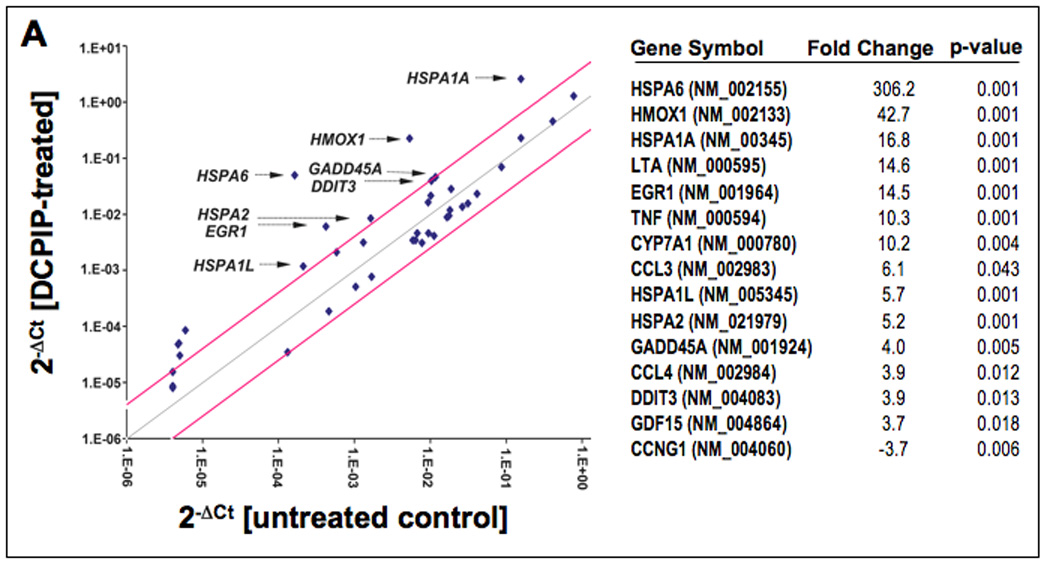
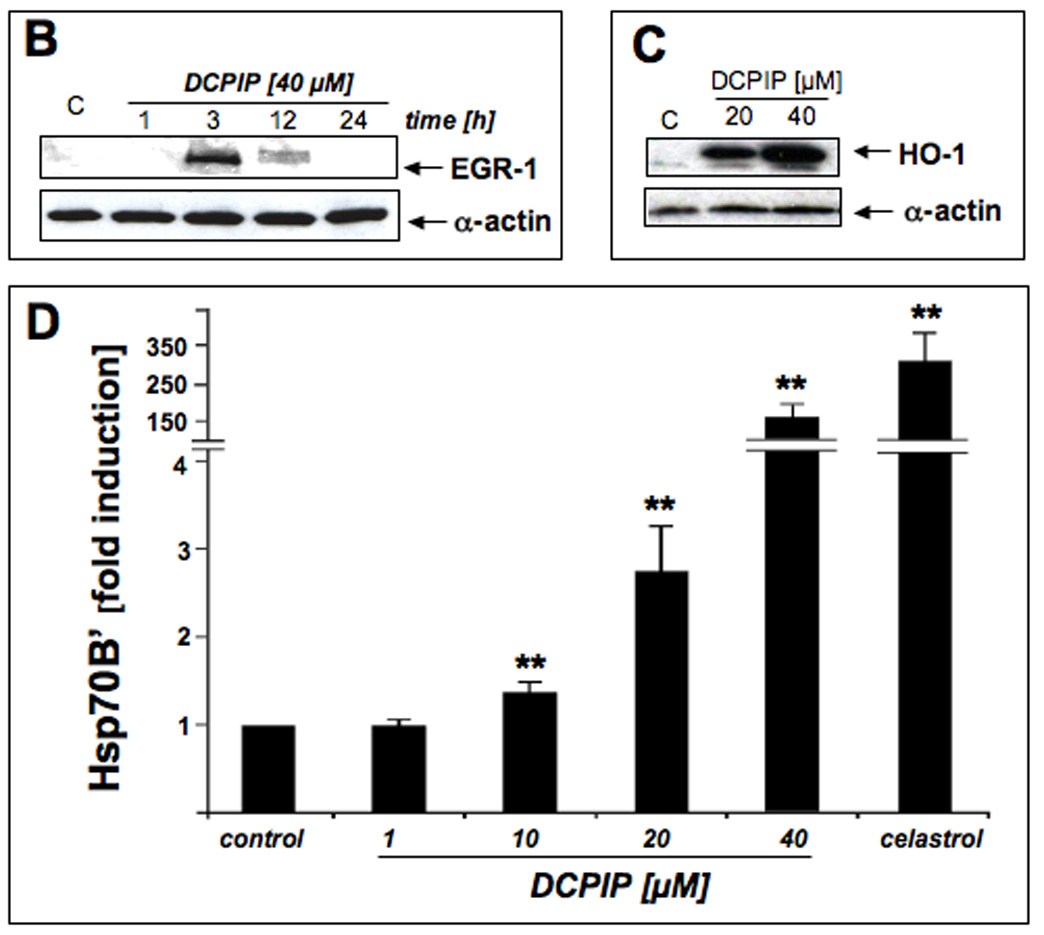
Figure 6. DCPIP induces oxidative stress and heat shock response gene expression in human A375 melanoma cells.


(A) DCPIP-induced gene expression changes in A375 human melanoma cells. The scatter blot (left panel) depicts differential gene expression as detected by the RT2 Human Stress and Toxicity Profiler™ PCR Expression Array technology profiling the expression of 84 (oxidative) stress- and toxicity related genes after DCPIP treatment (40 µM, 24 h). Upper and lower lines represent the cut-off indicating three fold up- or down-regulated expression, respectively. Arrows specify selected genes with at least 4 fold up-regulated expression versus untreated controls. Expression array analysis was performed in three independent repeats and analyzed using the two-sided Student’s t test. The table (right panel) summarizes statistically significant expression changes by at least three fold (p < 0.05). (C) The time course of DCPIP-modulation (40 µM) of early growth response protein 1 (EGR1) levels was examined by immunoblot analysis of total cellular protein extracts. Detection of α-actin expression served as a loading control. (C) DCPIP-modulation (20 and 40 µM, 24 h exposure) of cellular heme oxygenase-1 (HO-1) protein levels were examined in total cellular protein extracts by immunoblot analysis. (D) Modulation of cellular Hsp70B’ protein levels by DCPIP (1, 10, 20, and 40 µM, 24 h) was examined in total cellular protein extracts followed by ELISA analysis as specified in Materials and Methods (mean ± SD, n=3). Treatment with celastrol (2 µM, 24 h exposure) was used as a positive control for pharmacological Hsp70B’ upregulation.
