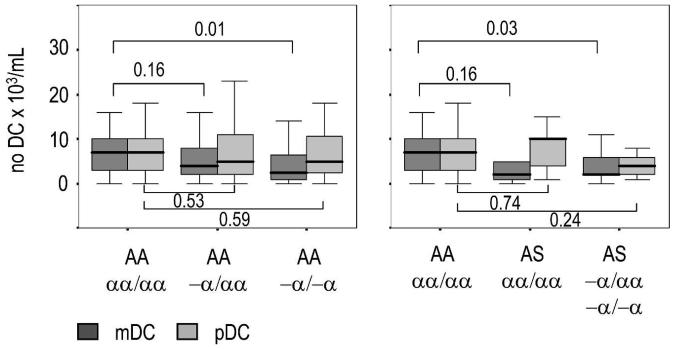
Figure 2.
Boxplots of the absolute number of myeloid dendritic cells (mDCs) and plasmocytoid DCs (pDCs) in the peripheral circulation of healthy Kenyan children with different hemoglobin genotypes. The absolute number of mDCs was reduced in children with α+ thalassesmia independent of whether the children were carriers of hemoglobin S. Medians are indicated by the solid black lines within the boxes, which represent the 25th and 75th percentiles. Errors bars indicate the 5th and 95th percentiles. The P values (numbers above and below the brackets) were obtained by pairwise comparisons of DC numbers using the Mann-Whitney U test.

