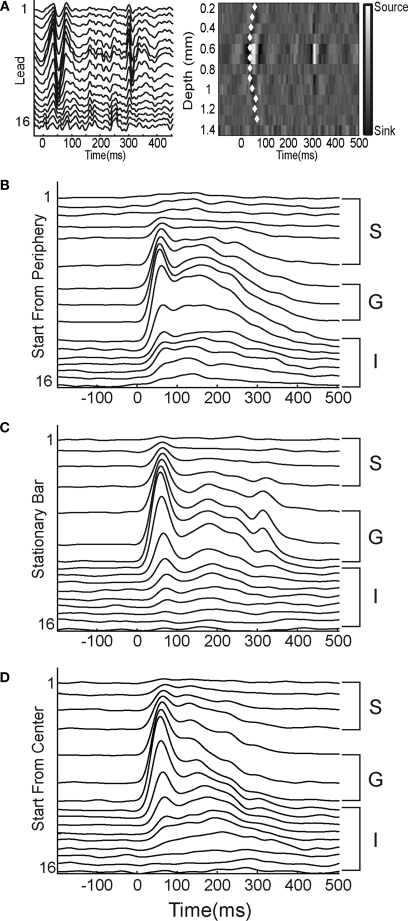
Figure 2.
Laminar MUA at the retinotopic sites of the appearance of the bar. (A) Laminar local field potentials (left) and CSD (right) in response to a stationary bar presented for 250 ms at the CFOV. Note the sinks in layer IV 30–35 ms after the start of the stimulus and again at 290 ms (OFF response). The white diamonds mark the onset of statistically significant MUA on each lead (p < 0.01, see Materials and Methods). (B–D) Laminar PSTHs, average of 50 trials, filtered with a 10 ms Gaussian temporal filter. S supragranular layers, G granular layer; I infragranular layers of the moving bar starting from the peripheral FOV (B), the stationary bar (C), and the moving bar starting from the CFOV (D). Note similarities in the ON responses.

