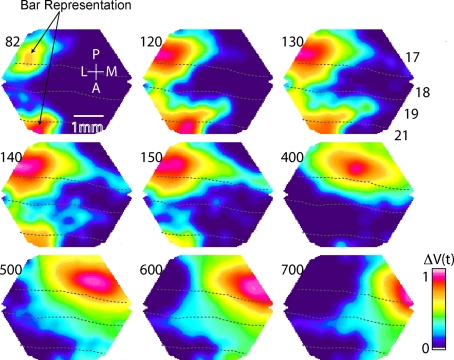
Figure 6.
Summary of main VSD signal findings. Bonferoni corrected and normalized, ΔV(t)rel(s), evoked by the presentation of a bar moving downwards from the peripheral FOV in an individual animal. At 82 ms the representation of the bar is appearing at the 17/18 and 19/21 borders (dashed lines). Note that the bar mapping on the cortex only corresponds to the maximal ΔV(t) increase. At ∼120 ms a ΔV(t) increase emerges in the area between the representation at the 19/21 border and the representation at the 17/18 border and another emerges in front of the bar map in 19/21. At 140 ms this shifts direction towards the 17/18 border. Then a ΔV(t) increase emerges from the 17/18 bar map ahead in the direction of motion over cortex along the 17/18 border. This is the SRP. From 400 to 700 ms the object representation is shown as it moves regularly along the 17/18 border and arrives at the site of the tip of the SRP at ∼700 ms.

