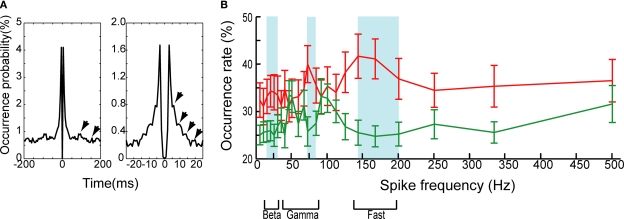
Figure 4.
(A) Auto-correlograms of whole SSSs among all possible pairs of neurons in a window of ±200 ms (left) and ±25 ms (right). The bin sizes are set, respectively, at 5 and 1 ms. The SSS oscillates slightly at ca. 20 and ca. 150 Hz (arrows). (B) The occurrence rate for the SSS (red) and non-SSS (green) as a function of the spike frequency. The blue shaded box highlighted bands of significant spike frequency (t-test; P < 0.05; see Materials and Methods). Error bars show SEM. The lower portion shows the bands of the beta, gamma and fast-ripple oscillations.

