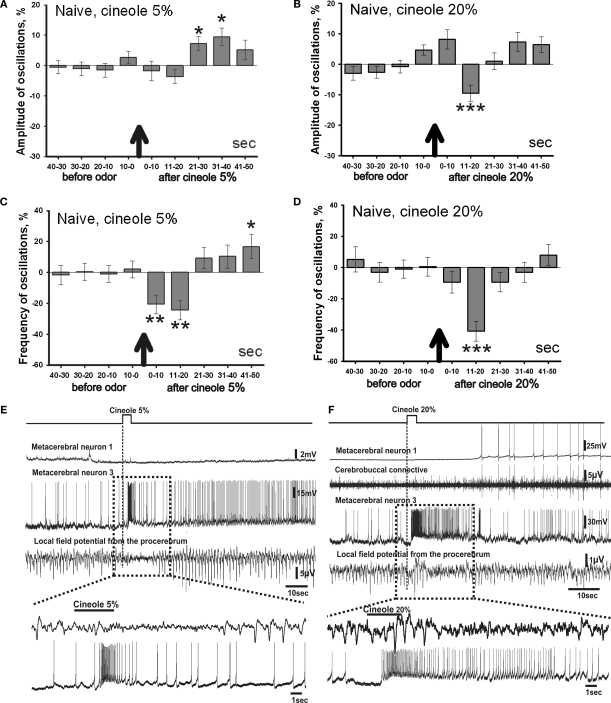
Figure 4.
Averaged changes of the oscillatory rhythm recorded in vitro in the procerebrum of naïve snails in response to odor application. (A) Changes in the amplitude of the procerebral oscillations in response to the cineole application in 5% (n = 5) and (B) 20% (n = 6) concentrations. (C) Changes in the frequency of the procerebral oscillations in response to cineole application in 5% (n = 5) and (D) 20% (n = 6) concentrations. Vertical bars indicate the standard error of the mean. Statistical significance here and on further figures was calculated in relation to the mean of the frequency or amplitude for 20 s before odor application taken as 100%. * p < 0.05, ** p < 0.01, *** p < 0.001, ANOVA, Dunn's method. (E,F) The response of the procerebrum, MtC3, MtC1 neurons and the cerebro-buccal connective to 5% (E) and 20% (F) cineole application to the nose–brain preparation of naïve snail. Only one example is shown, traces below here and on further figures show part of the response at another time scale. (E) A decrease in the amplitude and frequency of the procerebrum oscillations was observed in semi-intact preparation of the naïve snail. No depolarization in MtC1 neuron after odor presentation was noted. Moderate intensity reaction of MtC3 neuron to cineole was observed. (F) A decrease in the amplitude and frequency of PC oscillations was observed in semi-intact preparation of the naïve snail in response to 20% cineole application. Depolarization in MtC1 neuron after odor presentation is evident.

