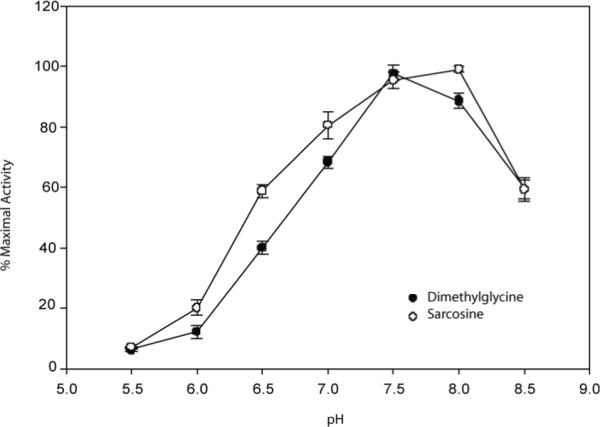
Figure 5.

A plot of the pH vs. % relative activity of SDMT. Reactions were performed from pH 5.5-8.5 in 100 mM MES, 100 mM HEPES, 100 mM TAPS and 100 μM MgCl2 at 37 °C. Activity levels of dimethylglycine (•) and sarcosine (°) are normalized to the pH of maximal activity. Reactions at each pH were performed in triplicate.
