
Figure 3.
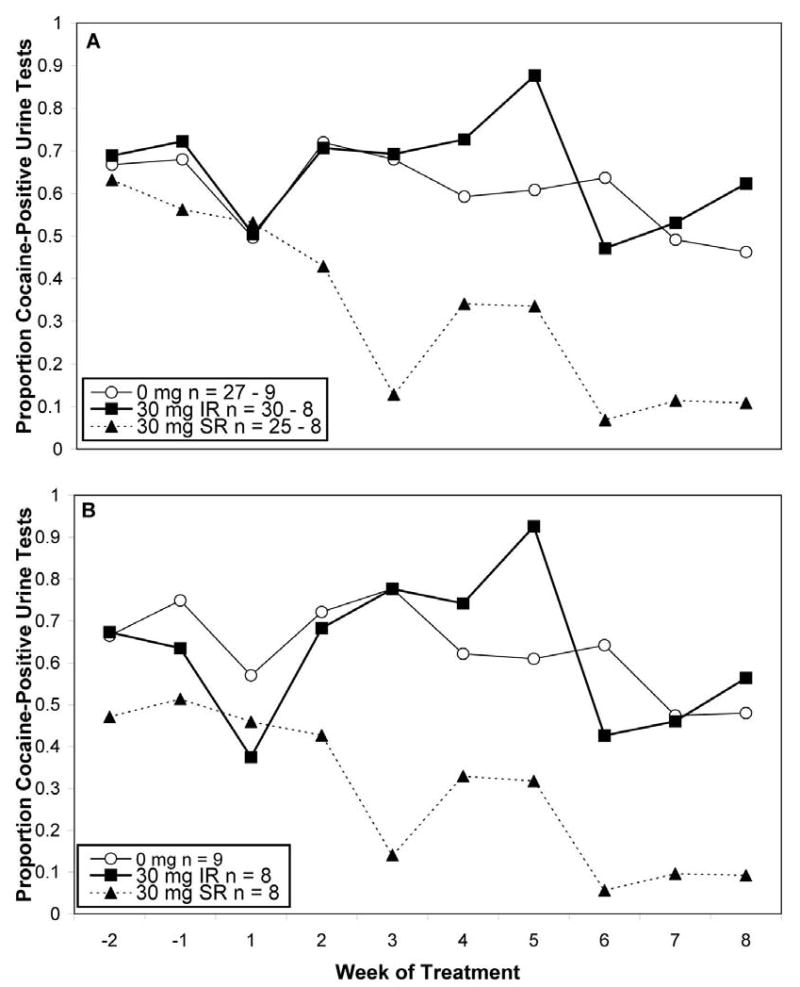
3A. Cocaine-use proportion in the intention-to-treat sample. Beginning (week 1 of treatment) and ending (week 8 of treatment) sample sizes are shown in the legend. The SR group had significantly fewer BE-positive urine tests than the placebo (0 mg) or IR conditions. 3B. Cocaine-use proportion in those completing treatment. Samples sizes are shown in the legend. The SR group had significantly fewer BE-positive urine tests than the placebo (0 mg) or IR conditions.