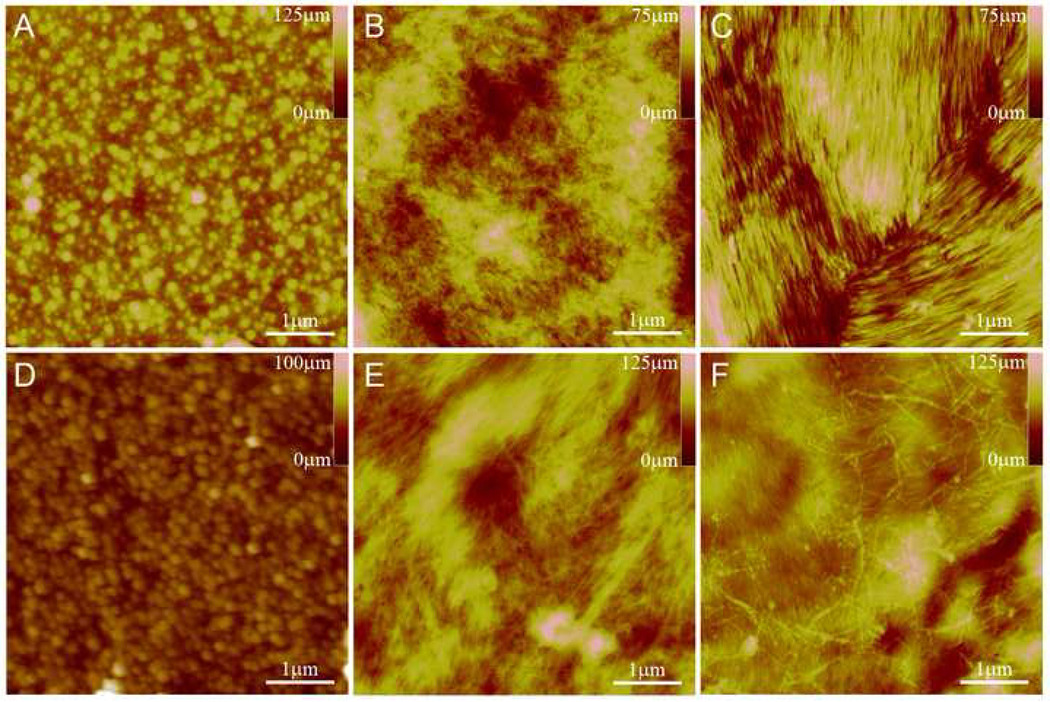
Figure 6.
AFM images of ST (A), C16-RGDS PA as DC-PA (B) and CA-PA (C), ST+CA (D), and pyr-RGDS PA as DC-PA (E) and CA-PA (F). B & C and E & F show that the PA nanofiber structure is maintained after covalent attachment. D is a control to show no change in topography due the covalent attachment process.

