
Fig. 5.
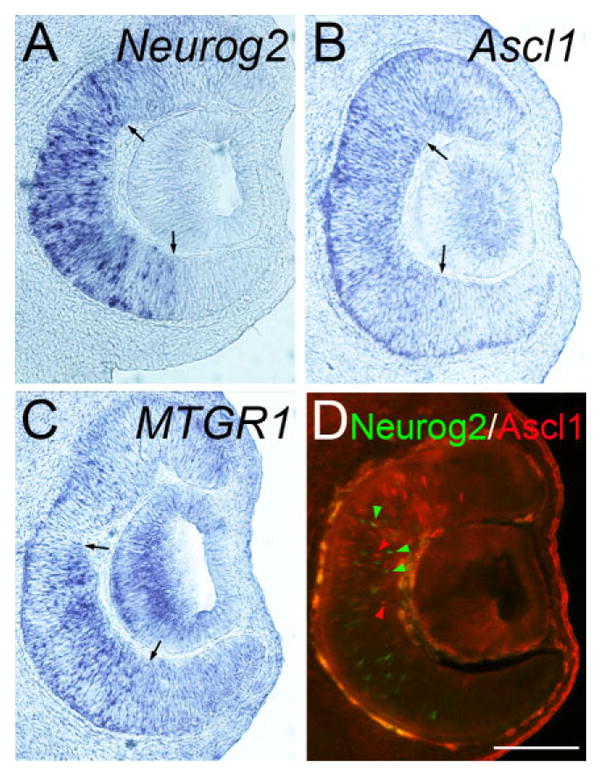
Retina at E11.5. Frontal sections of the retina at E11.5. Midline is to the left. In situ hybridization for Neurog2 (A), Ascl1 (B), MTGR1 (C) as well as double immunohistochemistry of Ascl1 and Neurog2 (D) is shown. Red and green arrowheads in D indicate Neurog2-positive and Ascl1-positive cells, respectively. These two populations do not significantly overlap at this stage. Scale bar = 200 μm.