
FIG. 3.
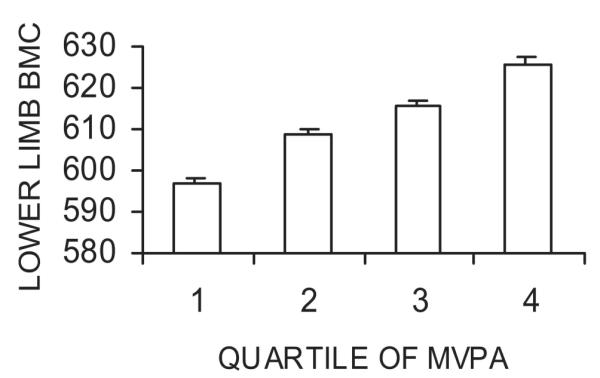
Effect of total MVPA on lower limb BMC. Figure shows mean BMC (g) ± SE according to quartile of total MVPA. Results were adjusted for age of DXA scan, sex, socio-economic factors, and height + lean mass + fat mass (n = 4457). p < 0.001 (F test for difference between quartiles).