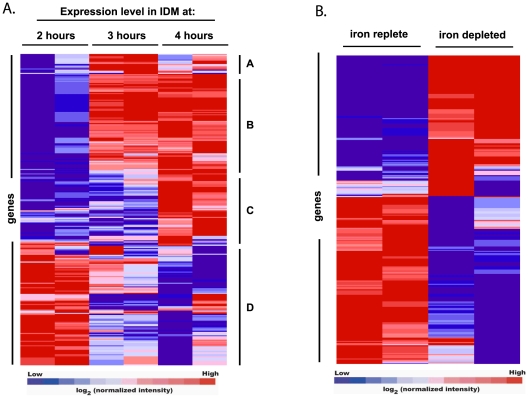
Figure 2. Changes in B. anthracis gene expression induced by iron starvation over time.
Hierarchical clustering of genes identified as statistically significant by J5 test across two independent microarray experiments. Fluorescence intensities were normalized as described in the methods. Normalized intensity values from two experiments were input into Gene Pattern together and clustered using the Pearson correlation. Genes clustered into four groups, induced with a peak at three hours (A), induced at three and four hours (B), induced at four hours (C), and repressed (D). Data shown are normalized intensity values over time for samples grown in IDM only.

