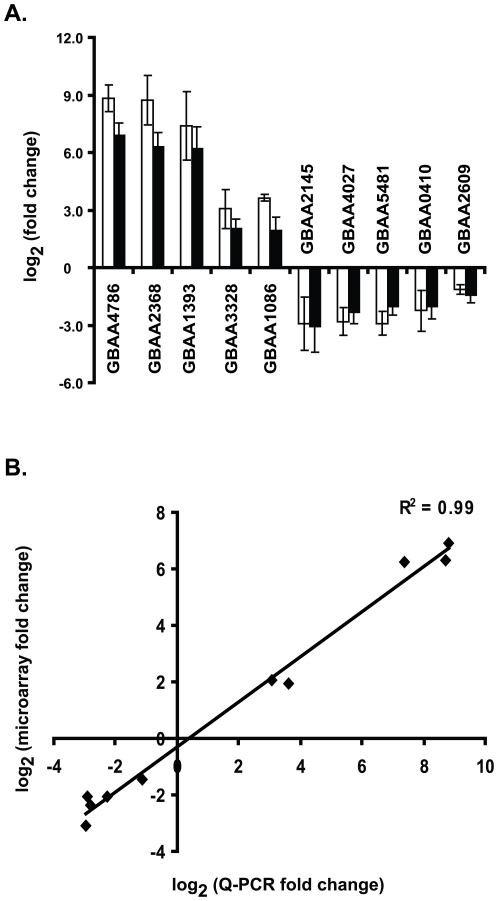
Figure 3. Validation of microarray data.
(A). Gene expression changes measured by Q-PCR at four hours. RNA from four experiments was tested for specific genes using real time PCR. The results of Q-PCR are represented with white bars, while corresponding values from the microarray experiments are represented with black bars. Data are presented as mean±SEM of log2 transformed fold change where fold change is the ratio of expression in IDM to IRM. (B). Correlation analysis comparing fold change between microarray and Q-PCR for ten B. anthracis genes. Data are plotted as log2 transformed microarray data compared to log2 transformed Q-PCR data. The correlation coefficient (R2) between these two analyses was 0.99.

